GEOTECHNICAL ENGINEERING
EUGENE OREGON
HomeLaboratoryGrain size analysis (sieve + hydrometer)

Grain Size Analysis (Sieve + Hydrometer) in Eugene Oregon

Geotechnical engineering with regional judgment.

LEARN MORE

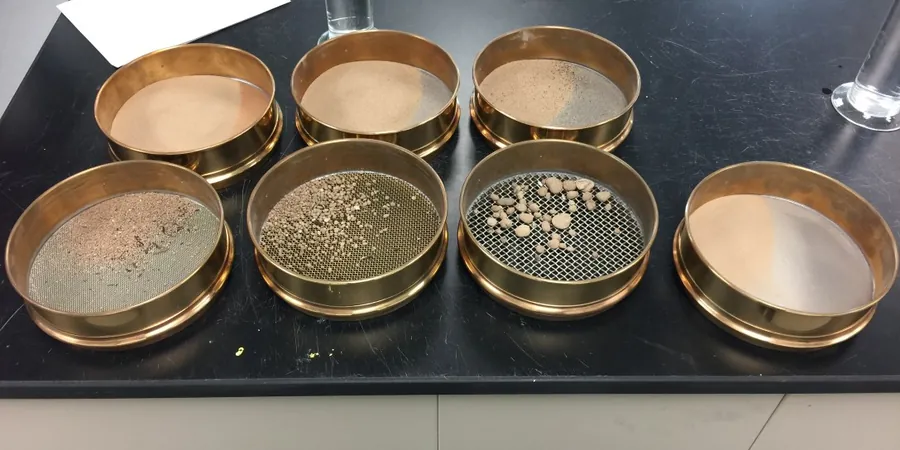
A recent mixed-use project near the Whiteaker neighborhood hit a complication familiar to anyone who works with Willamette Valley soils: the upper 4 feet looked like decent sandy silt, but the gradation curve told a different story below that depth. The fines content jumped past 40 percent, which completely changed the drainage assumptions for the foundation. That is exactly the type of situation where a combined sieve and hydrometer analysis becomes non-negotiable. We see this pattern across Eugene, where the transition from Missoula Flood deposits to the older Spencer Formation creates sharp changes in gradation over short vertical distances. A full grain size distribution curve, from the coarse fraction down through the silt and clay range, gives the design team the particle-size data needed to classify the material correctly under ASTM D2487 and to predict how water and load will interact with the subgrade. In our experience, skipping the hydrometer portion on silty sites along the Willamette is a gamble that shows up later as unexpected settlement or poor compaction response. When the project also involves deep foundation elements, we often pair this analysis with CPT testing to correlate the continuous tip resistance profile with the laboratory gradation results, especially where the stratigraphy is too variable for discrete sampling alone.

A complete grain size curve is the single most cost-effective index test for predicting how Willamette Valley soils will behave under load and moisture change.

Our service areas

Methodology and scope

One thing we notice repeatedly in the Eugene-Springfield metro is that natural soils classified as 'silty sand' in the field often plot as silt with sand in the lab once the hydrometer data comes in. The distinction matters enormously for seismic site class determination under ASCE 7 and for liquefaction screening. The combined test starts with a dried, weighed specimen that passes through a stack of sieves from the 3-inch down to the No. 200, following ASTM D6913. The minus-200 material then goes into sedimentation, where a hydrometer reads the density of the suspension at timed intervals per ASTM D422. The resulting curve plots particle diameter on a logarithmic scale against percent passing, giving you the full picture from gravel down to colloidal clay. For road projects in Lane County, this data feeds directly into the CBR assessment and helps the pavement designer understand how the subgrade will behave under seasonal moisture cycles. We run every sample with dispersing agent and mechanical stirring to break down clay aggregations that would otherwise read as silt, which is a common pitfall when labs rush the hydrometer prep. The entire process typically takes 24 to 72 hours, depending on the clay fraction, and the report includes the coefficient of uniformity, coefficient of curvature, and the USCS group symbol.
Grain Size Analysis (Sieve + Hydrometer) in Eugene Oregon
Technical reference — Eugene Oregon

Local considerations

Eugene sits in a moderate-to-high seismic hazard zone, and the city's alluvial and flood-deposited soils contain extensive layers of loose, saturated silty sand that are prime candidates for liquefaction under a Cascadia Subduction Zone event. Grain size distribution is one of the primary screening tools used in the simplified liquefaction assessment procedure. Soils with more than 35 percent fines by weight, measured by the hydrometer portion of the test, behave fundamentally differently during cyclic loading than clean sands, and the gradation curve directly influences the correction factors applied to SPT blow counts or CPT tip resistance. Without an accurate hydrometer analysis, a borderline silty sand can be mischaracterized as clean sand, leading to an over-prediction of liquefaction susceptibility and unnecessarily expensive ground improvement. We also see risk in earthwork specifications that rely on a single gradation target when the borrow source in the Eugene area varies significantly from one end of the pit to the other. Running grain size checks at the recommended frequency pays for itself in avoided re-compaction and failed density tests. For projects near the McKenzie River, the high water table combined with poorly graded sands creates a scenario where internal erosion and piping become real concerns, and the gradation curve is the first line of defense in filter design.

Need a geotechnical assessment?

Reply within 24h.

Email: contact@geotechnical-engineering.vip

Applicable standards

ASTM D6913 – Standard Test Methods for Particle-Size Distribution (Gradation) of Soils Using Sieve Analysis, ASTM D422 – Standard Test Method for Particle-Size Analysis of Soils (Hydrometer), ASTM D2487 – Standard Practice for Classification of Soils for Engineering Purposes (Unified Soil Classification System), AASHTO T 88 – Particle Size Analysis of Soils, ASCE 7 – Minimum Design Loads and Associated Criteria for Buildings (seismic site class)

Technical parameters

ParameterTypical value
Test standard (sieve)ASTM D6913 / AASHTO T 88
Test standard (hydrometer)ASTM D422
Sieve size range75 mm (3 in) to 0.075 mm (No. 200)
Hydrometer particle range0.05 mm down to approximately 0.001 mm
Dispersing agentSodium hexametaphosphate solution
Minimum specimen massDetermined by maximum particle size per ASTM D6913
Reporting parametersD10, D30, D60, Cu, Cc, % gravel, sand, silt, clay
Relevant classificationUSCS per ASTM D2487, AASHTO M 145

Frequently asked questions

How long does a full sieve and hydrometer analysis take in your Eugene lab?

The complete process typically takes three to five business days. The sieve portion runs in about one day, but the hydrometer sedimentation requires timed readings over a 24-hour period minimum, plus specimen preparation, oven drying, and final data reduction. Soils with higher clay content need longer sedimentation times. We can accommodate a limited number of rush requests depending on current lab workload.

How much does a grain size analysis including hydrometer cost for a Eugene project?
Why is the hydrometer portion necessary if I already have the sieve data?

The No. 200 sieve only tells you how much material passes the 0.075 mm opening; it says nothing about whether that fine fraction is silt or clay. The hydrometer analysis separates the silt and clay ranges by measuring the sedimentation rate in a liquid suspension, which is essential for USCS classification, liquefaction screening, and predicting drainage and volume-change behavior. In the silty soils common across Eugene, skipping the hydrometer leads to misclassification and can mask a liquefiable or compressible layer.

Location and service area

We serve projects across Eugene Oregon and its metropolitan area.

View larger map